Contents
- 📊 Introduction to Data Visualization
- 📈 History of Data Visualization
- 📁 Types of Data Visualization
- 📊 Quantitative Data Visualization
- 📄 Qualitative Data Visualization
- 📈 Best Practices for Data Visualization
- 📊 Tools and Technologies for Data Visualization
- 📁 Applications of Data Visualization
- 📊 Challenges and Limitations of Data Visualization
- 📈 Future of Data Visualization
- 📁 Data Visualization in Real-World Scenarios
- Frequently Asked Questions
- Related Topics
Overview
Data visualization is a rapidly evolving field that combines art, science, and technology to communicate complex data insights. With the exponential growth of data, effective visualization has become crucial for businesses, researchers, and policymakers to make informed decisions. Pioneers like Edward Tufte, John Snow, and Florence Nightingale have laid the foundation for modern data visualization, which now encompasses a wide range of tools and techniques, from interactive dashboards to immersive experiences. The field is not without controversy, with debates surrounding the role of aesthetics versus functionality, and the potential for visualizations to mislead or manipulate. As data continues to proliferate, the demand for skilled data visualization professionals is on the rise, with companies like Tableau, Power BI, and D3.js leading the charge. With a vibe score of 8, data visualization is an exciting and dynamic field that is poised to continue shaping the way we understand and interact with data, with potential applications in fields like healthcare, finance, and environmental science.
📊 Introduction to Data Visualization
Data visualization is the practice of designing and creating graphic or visual representations of data science and information with the help of static, dynamic or interactive visual items. These visualizations are intended to help a target audience visually explore and discover, quickly understand, interpret and gain important insights into otherwise difficult-to-identify structures, relationships, correlations, local and global patterns, trends, variations, constancy, clusters, outliers and unusual groupings within data analysis. When intended for the public to convey a concise version of information in an engaging manner, it is typically called infographics. Data visualization is a key component of business intelligence and is used to support decision-making and drive business outcomes. For example, Tableau is a popular data visualization tool used by many organizations to create interactive and dynamic visualizations.
📈 History of Data Visualization
The history of data visualization dates back to the 18th century, when William Playfair created the first statistical graphics. Since then, data visualization has evolved significantly, with the development of new tools and technologies, such as D3.js and Matplotlib. Today, data visualization is a critical component of data science and is used in a wide range of applications, including business analytics, scientific research, and government. The use of data visualization has also become more widespread, with the development of infographics and other forms of visual communication. For instance, John Snow used data visualization to identify the source of a cholera outbreak in London in the 19th century.
📁 Types of Data Visualization
There are several types of data visualization, including static visualization, dynamic visualization, and interactive visualization. Static visualization refers to visualizations that do not change over time, while dynamic visualization refers to visualizations that change over time. Interactive visualization refers to visualizations that allow users to interact with the data, such as by filtering or drilling down into the data. For example, Google Data Studio is a tool that allows users to create interactive and dynamic visualizations. Additionally, Power BI is a business analytics service that provides interactive visualizations and business intelligence capabilities.
📊 Quantitative Data Visualization
Quantitative data visualization refers to the visualization of numerical data, such as time series data or geospatial data. This type of visualization is commonly used in financial analysis and scientific research. Quantitative data visualization can be used to identify trends, patterns, and correlations in the data, and to communicate complex data insights to a wide range of audiences. For instance, Excel is a popular tool for creating quantitative data visualizations, such as charts and graphs. Furthermore, Python is a programming language that is widely used for quantitative data visualization, with libraries such as Pandas and NumPy.
📄 Qualitative Data Visualization
Qualitative data visualization refers to the visualization of non-numerical data, such as text data or image data. This type of visualization is commonly used in social science research and humanities. Qualitative data visualization can be used to identify themes, patterns, and relationships in the data, and to communicate complex data insights to a wide range of audiences. For example, Gephi is a tool that allows users to create qualitative data visualizations, such as network visualizations. Additionally, R is a programming language that is widely used for qualitative data visualization, with libraries such as Tidytext and Tidyr.
📈 Best Practices for Data Visualization
Best practices for data visualization include keeping it simple, using color effectively, and avoiding 3D. Data visualization should be designed to communicate complex data insights in a clear and concise manner, and should be tailored to the needs and goals of the target audience. For instance, Edward Tufte is a well-known expert in data visualization who has written extensively on the topic of best practices. Furthermore, Stephen Few is another expert who has written about the importance of simplicity and clarity in data visualization.
📊 Tools and Technologies for Data Visualization
There are many tools and technologies available for data visualization, including Tableau, Power BI, and D3.js. These tools can be used to create a wide range of visualizations, from simple bar charts to complex interactive dashboards. When selecting a tool or technology for data visualization, it is important to consider the needs and goals of the project, as well as the skills and expertise of the team. For example, Matplotlib is a popular library for creating static and interactive visualizations in Python. Additionally, Seaborn is a library that provides a high-level interface for creating informative and attractive statistical graphics.
📁 Applications of Data Visualization
Data visualization has a wide range of applications, including business analytics, scientific research, and government. Data visualization can be used to support decision-making, drive business outcomes, and communicate complex data insights to a wide range of audiences. For instance, data journalism is a field that uses data visualization to tell stories and communicate complex data insights to the public. Furthermore, data storytelling is a technique that uses data visualization to create engaging and interactive stories.
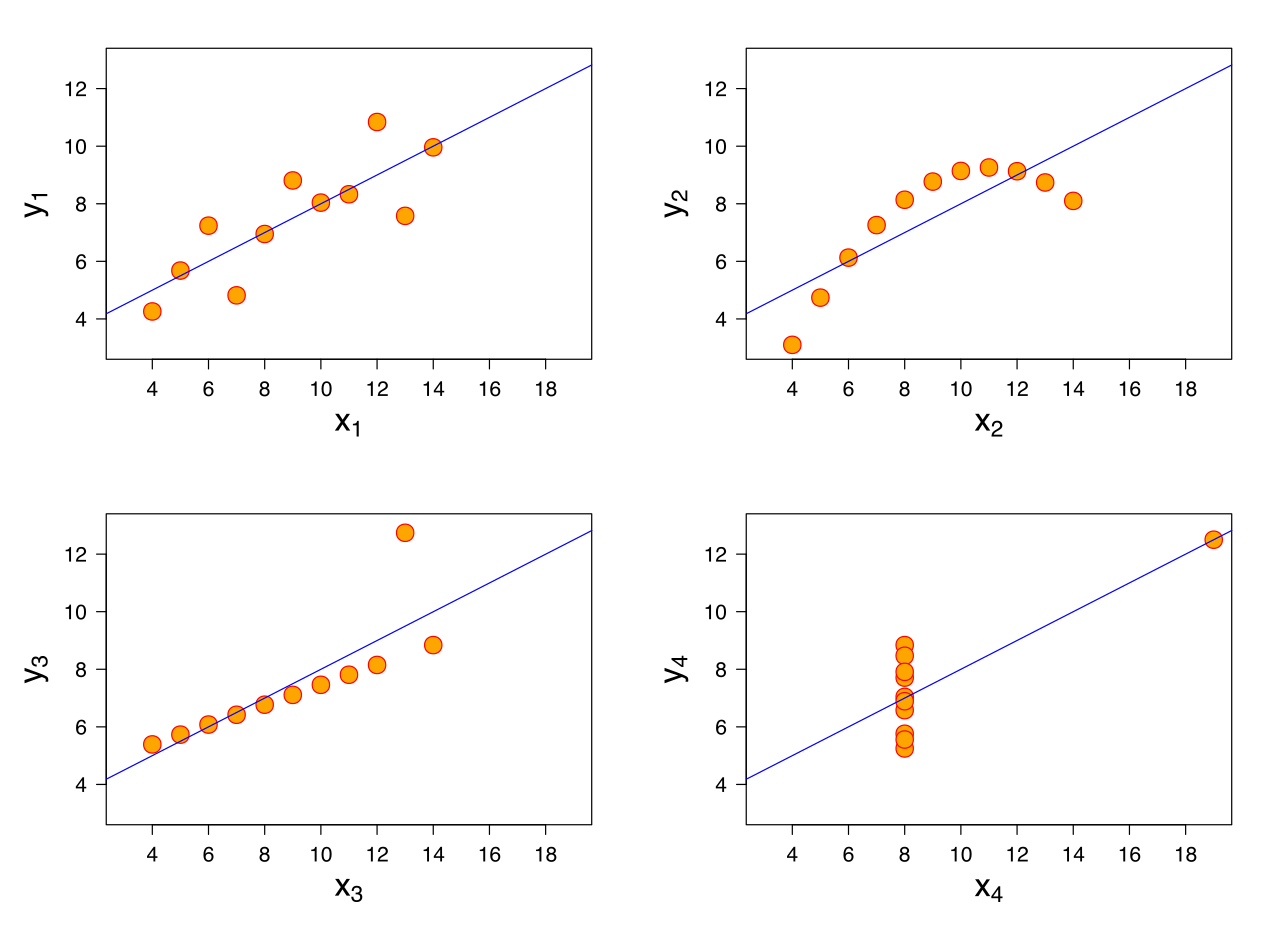
📊 Challenges and Limitations of Data Visualization
Despite its many benefits, data visualization also has several challenges and limitations. These include data quality issues, visualization bias, and interpretation challenges. Data visualization can be used to mislead or deceive, and it is important to be aware of these potential pitfalls when creating or interpreting visualizations. For example, Anscombe's quartet is a well-known example of how data visualization can be used to illustrate the importance of looking beyond summary statistics. Additionally, Ben Fry is a well-known expert in data visualization who has written about the importance of considering the limitations and challenges of data visualization.
📈 Future of Data Visualization
The future of data visualization is likely to be shaped by advances in artificial intelligence, machine learning, and virtual reality. These technologies have the potential to enable new forms of data visualization, such as interactive simulations and immersive visualizations. As data visualization continues to evolve, it is likely to play an increasingly important role in supporting decision-making and driving business outcomes. For instance, augmented reality is a technology that is being used to create interactive and immersive visualizations. Furthermore, natural language processing is a technique that is being used to create interactive and dynamic visualizations.
📁 Data Visualization in Real-World Scenarios
Data visualization is used in a wide range of real-world scenarios, including business, government, and non-profit. Data visualization can be used to support decision-making, drive business outcomes, and communicate complex data insights to a wide range of audiences. For example, COVID-19 is a global pandemic that has been tracked and visualized using data visualization. Additionally, climate change is a global issue that is being tracked and visualized using data visualization.
Key Facts
- Year
- 2022
- Origin
- Ancient civilizations, with modern developments emerging in the 19th century
- Category
- Data Science
- Type
- Concept
Frequently Asked Questions
What is data visualization?
Data visualization is the practice of designing and creating graphic or visual representations of data and information with the help of static, dynamic or interactive visual items. It is used to support decision-making, drive business outcomes, and communicate complex data insights to a wide range of audiences. For example, data visualization tools such as Tableau and Power BI are widely used in business analytics.
What are the benefits of data visualization?
The benefits of data visualization include the ability to quickly understand and interpret complex data, identify patterns and trends, and communicate data insights to a wide range of audiences. Data visualization can also be used to support decision-making and drive business outcomes. For instance, data storytelling is a technique that uses data visualization to create engaging and interactive stories. Additionally, data journalism is a field that uses data visualization to tell stories and communicate complex data insights to the public.
What are the challenges and limitations of data visualization?
The challenges and limitations of data visualization include data quality issues, visualization bias, and interpretation challenges. Data visualization can be used to mislead or deceive, and it is important to be aware of these potential pitfalls when creating or interpreting visualizations. For example, Anscombe's quartet is a well-known example of how data visualization can be used to illustrate the importance of looking beyond summary statistics. Furthermore, Ben Fry is a well-known expert in data visualization who has written about the importance of considering the limitations and challenges of data visualization.
What are the future trends in data visualization?
The future trends in data visualization include the use of artificial intelligence, machine learning, and virtual reality to enable new forms of data visualization, such as interactive simulations and immersive visualizations. For instance, augmented reality is a technology that is being used to create interactive and immersive visualizations. Additionally, natural language processing is a technique that is being used to create interactive and dynamic visualizations.
What are the applications of data visualization?
The applications of data visualization include business analytics, scientific research, government, and non-profit. Data visualization can be used to support decision-making, drive business outcomes, and communicate complex data insights to a wide range of audiences. For example, COVID-19 is a global pandemic that has been tracked and visualized using data visualization. Additionally, climate change is a global issue that is being tracked and visualized using data visualization.
What are the best practices for data visualization?
The best practices for data visualization include keeping it simple, using color effectively, and avoiding 3D. Data visualization should be designed to communicate complex data insights in a clear and concise manner, and should be tailored to the needs and goals of the target audience. For instance, Edward Tufte is a well-known expert in data visualization who has written extensively on the topic of best practices. Furthermore, Stephen Few is another expert who has written about the importance of simplicity and clarity in data visualization.
What are the tools and technologies used for data visualization?
The tools and technologies used for data visualization include Tableau, Power BI, D3.js, and Matplotlib. These tools can be used to create a wide range of visualizations, from simple bar charts to complex interactive dashboards. For example, Google Data Studio is a tool that allows users to create interactive and dynamic visualizations. Additionally, Seaborn is a library that provides a high-level interface for creating informative and attractive statistical graphics.